Introduction
SQL query optimization tools determine the best way to execute a query by analyzing different query plans and seeing which one delivers the best performance. After obtaining the results, the query optimization tools use the most efficient query plan to run the query.
The performance metrics include:
- Execution
- Query duration
- CPU time
- Logical and physical reads
This article lists 13 best SQL query optimization tools, so you choose which one is right for you.
EverSQL Query Optimizer
EverSQL is a query optimizer that improves the database server performance by making queries run faster.
EverSQL notable features are:
- Automatic query rewriting.
- Code comparison and change notes after query rewriting.
- Indexing recommendations for improving query speed.
- Advanced optimization options after adding the schema.
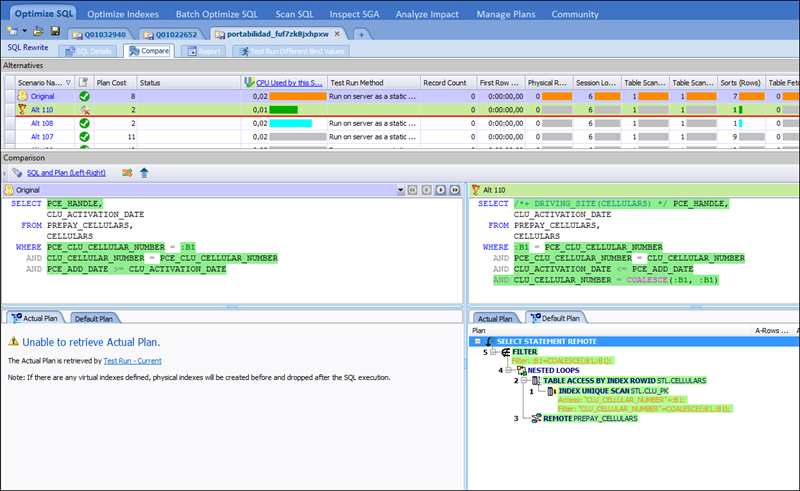
The image below shows the code comparison feature in EverSQL.
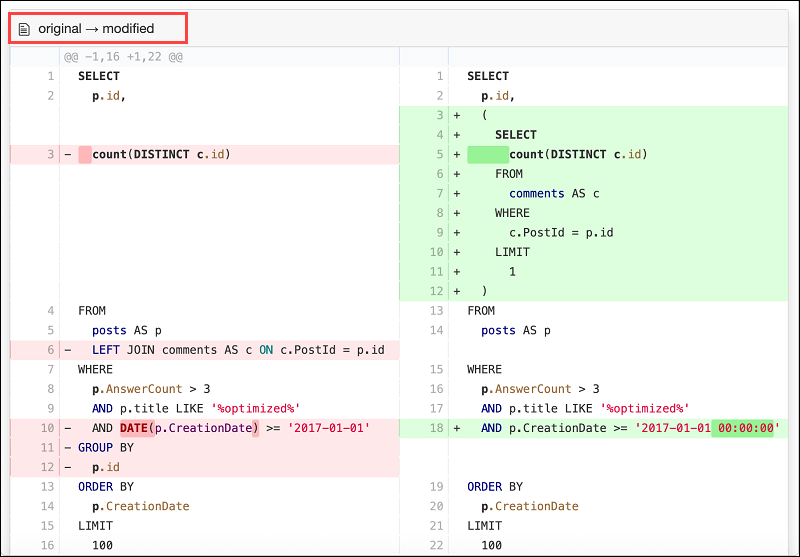
The automatic query rewriting feature automates query optimization, and EverSQL also offers code comparison and change notes after rewriting the query. The code comparison feature allows users to see what was changed to improve query performance.
Moreover, EverSQL offers indexing recommendations for multiple queries simultaneously. The tool supports MySQL, MariaDB, and PerconaDB database management systems (DBMS).
The free trial version lasts 14 days and offers 50 query optimizations.
Note: Learn how to speed up your MySQL database by creating indexes.
APEXSQL Plan
The APEXSQL Plan query optimization tool allows users to create execution plan diagrams. The tool lets you resize, modify, and observe query execution in real-time with data flow information.
Other features are:
- Managing property details for each operation in an execution plan.
- Configuring sub-elements (nodes, connectors, etc.).
- Managing and reviewing details for each data flow in an execution plan.
The image below is an example of APEXSQL Plan UI and query execution plan.
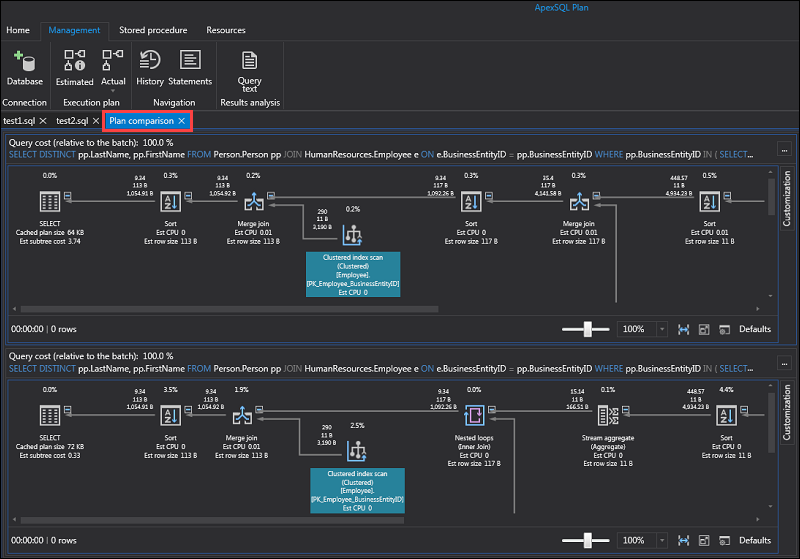
The tool can determine missing database indexes and recreate them in the execution plan section.
APEXSQL Plan, however, only supports SQL servers and cannot rewrite existing queries.
SQL Azure Query Performance Insight
Azure Query Performance Insight provides query analyses for single and pooled databases. The tool also helps determine which queries consume the most resources in users' workloads. The results allow users to identify which queries need optimization.
Azure Query Performance Insight provides several features, including:
- Insight into the database resource consumption (DTU), measured as a combination of CPU, IO, and memory usage in a database.
- Detailed information about the highest resource-consuming queries (CPU, duration, execution count, etc.).
- Inspection of query details, including the code and resource usage history.
- Manual annotations regarding performance recommendations.
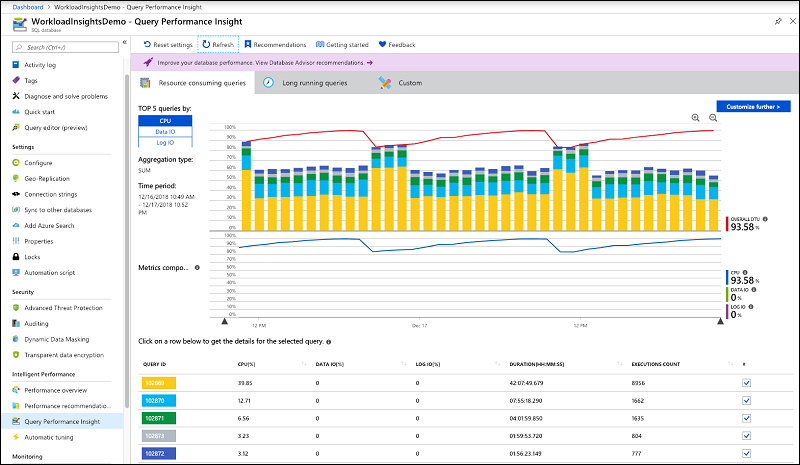
The image above shows query performance details in SQL Azure.
SQL Azure Query Performance Insights supports only Azure and doesn't come with the option for query rewrites. A prerequisite for using it is to enable the Query store.
Note: Read our article to see how to improve MySQL performance with tuning.
Toad SQL Optimizer for Oracle
Toad SQL Optimizer for Oracle supports Oracle databases. The tool uses an algorithm to find alternative mechanisms for improving existing SQL statements and allows users to choose the best alternative.
The Toad for Oracle key features are:
- Profiler feature, allows measuring query performance, including the query execution time.
- Graphical representation of analyses, pointing to any critical issues, such as performance bottlenecks.
- Team coding feature, allowing users to team up in a collaborative environment, enabling a smooth developing experience.
The image below shows the query optimization process in Toad for Oracle.
Toad for Oracle comes in several versions with varying prices for different functionalities and includes a 30-day free trial.
SQL Query Tuner for SQL Diagnostic Manager
SQL Query Tuner is an add-on for SQL Diagnostic Manager. The tool allows users to identify problematic queries via database profiling and wait time analysis and graphically represent the results.
The Tuner automatically generates tuning recommendations through the SQL query tuning wizard and verifies query performance via load testing in simulated production environments.
Some features of SQL Query Tuner are:
- Color-coded analysis of used, unused, and missing indexes.
- Generating possible SQL query rewrites and best alternatives.
- Visual query tuning diagrams representing query performance impact.
- Table statistics displaying table indexes, constraints, and JOINS used in an SQL statement.
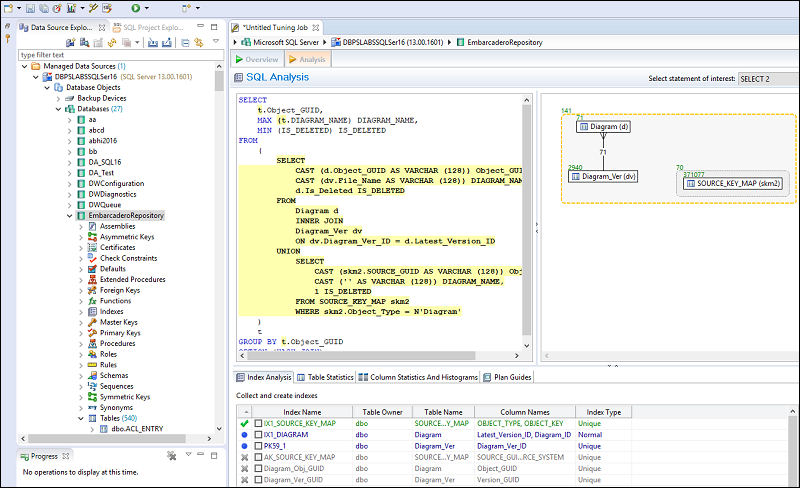
Users can run queries multiple times simultaneously and see how they behave in a simulated environment, avoiding the risk of testing the query in production.
The image shows SQL analysis and a visual query tuning diagram in SQL Query Tuner.
The product comes with a 14-day trial, and users can also purchase the SQL Diagnostic Manager.
SolarWinds Database Performance Analyzer
The SolarWinds Database Performance Analyzer comes with performance monitoring and an in-built query tuner for query optimization.
The Analyzer tool allows users to monitor performance, client machines, users, and applications via a dashboard, represents their performance and any anomalies, and identifies which SQL query to focus on.
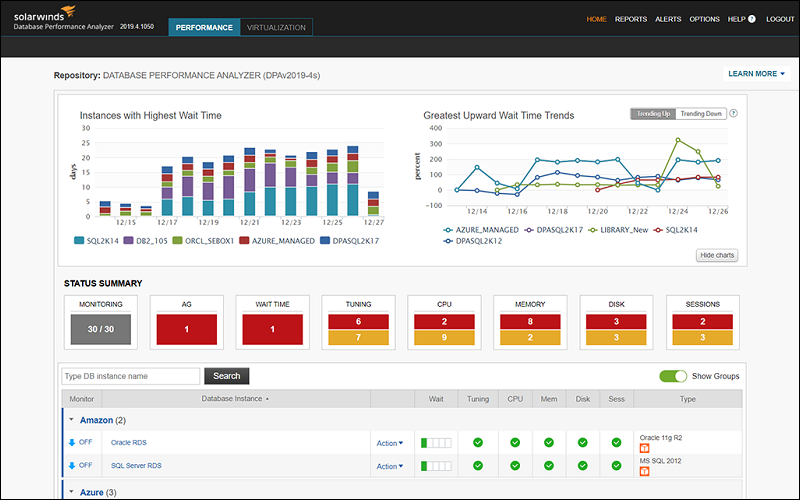
The image above shows color-coded graphs depicting wait times in SolarWinds Analyzer.
Some of SolarWinds Analyzer features are:
- Top Waits for SQL that displays network state and performance.
- Database status, including wait time, tuning, CPU, memory, and disk statistics.
- Color-coded graphs for each information category.
The SolarWinds Analyzer supports Azure SQL databases, MySQL, Aurora, ASE, Oracle, MariaDB, and IBM Db2. The tool comes with a fully functional 14-day free trial.
Paessler PRTG Network Monitor
The Paessler PRTG Network Monitor tool monitors Microsoft SQL, MySQL, Oracle SQL, and PostgreSQL databases. PRTG Network Monitor makes SQL query monitoring and optimization simple and measures the time needed for executing SQL query requests.
The key features are:
- A dashboard displaying query execution times, network state, and any query performance issues.
- Preconfigured SQL sensors to monitor individual databases.
- A threshold-based alert system notifying the users about performance issues.
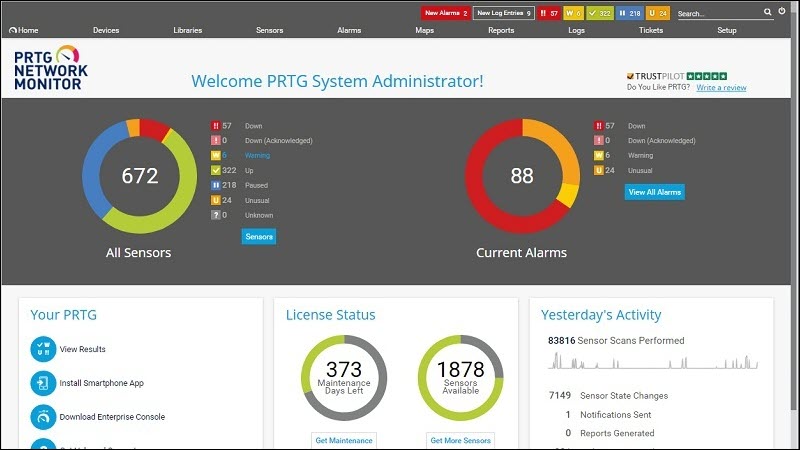
The photo above shows the PTRG dashboard overview of alarms triggered, available sensors, and other metrics.
The alert system notifies users immediately after recognizing an issue, and the users can choose how to receive notifications.
PRTG Network Monitor comes with a free trial, and the paid versions vary in sensor numbers and the number of server installations.
Note: Learn how to reduce your server response time.
SentryOne SQL Sentry
SentryOne is a database performance monitoring tool that focuses on troubleshooting performance issues. Some of its features are:
- Alert thresholds for getting notifications when queries are running slowly.
- Top SQL that lists all queries exceeding the minimum duration specified.
- Execution plan diagrams allowing users to discover unoptimized queries affecting the performance.
- Deadlock analysis showing an overview of database deadlocks.
- Block detection displaying a hierarchy of blocking processes.
The preconfigured baselines help users identify resource bottlenecks, user connections, batches, transactions, and various other metrics for monitoring SQL server waits, CPU waits, etc.
The alert system notifies the user if a query execution is slow.
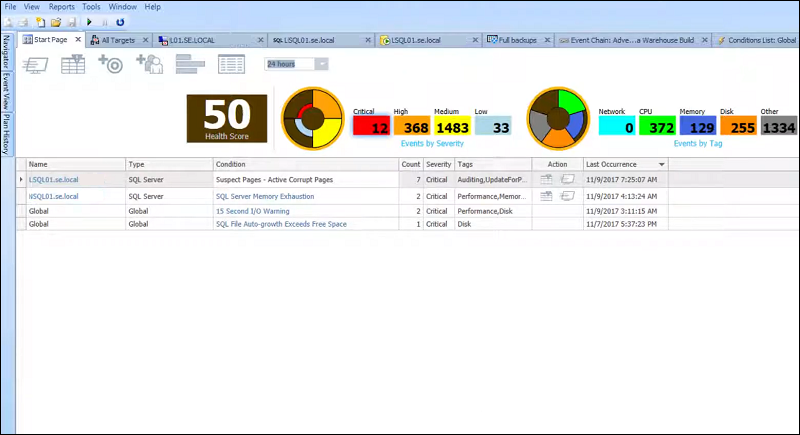
The image above shows the SentryOne start page with a graphical representation of alerts, CPU and memory usage, etc.
SentryOne allows users to automate the query tuning process by setting which database action to perform when a threshold condition is triggered.
The tool comes with a two-week free trial and several paid versions with a different number of features.
Redgate SQL Monitor
Redgate SQL Monitor is a query optimization tool that features customizable alerts, custom reporting, and a dashboard for monitoring SQL performance.
The main features are:
- A detailed dashboard updating in 15-second intervals, displaying CPU, memory, disk usage, reads and writes, and database wait times.
- A customizable alert system, allowing users to set a custom metric alert threshold in addition to the standard Machine, SQL Server and Database metrics.
- Help for resolving query performance issues.
When a performance issue arises, Redgate SQL Monitor provides additional information to help determine the cause.
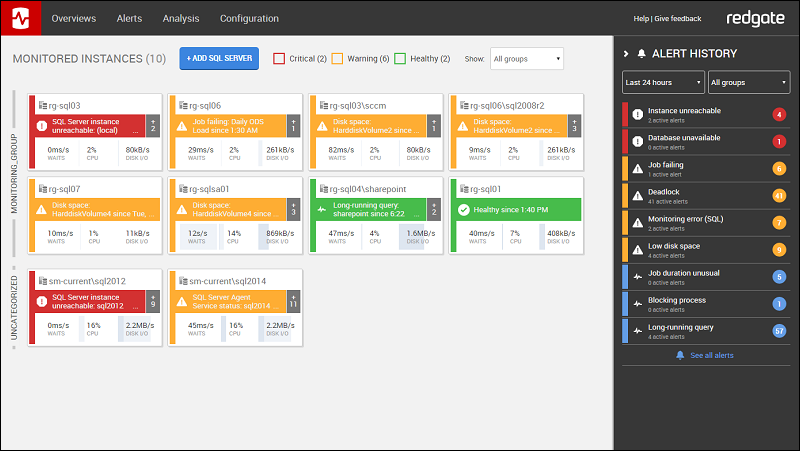
The image above shows the Redgate SQL Monitor UI with an overview of several monitored servers.
The alert system includes more than 40 templates that users can customize to receive alerts about performance issues, poor query performance, or blocked processes.
Redgate's SQL monitor comes with a 14-day free trial and several paid versions, including different features and the number of servers supported.
Idera DB Optimizer
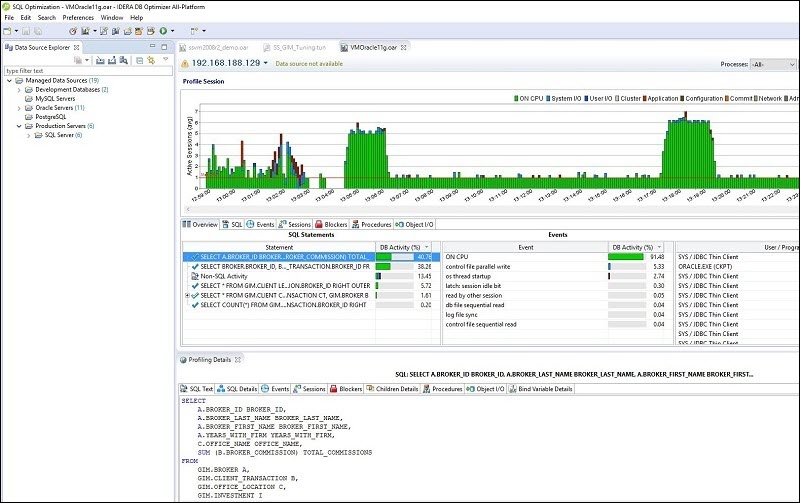
Idera DB Optimizer is a database optimizer compatible with SQL Server, Oracle, DB2, and Sybase, and it is excellent for medium-sized businesses.
The tool identifies performance issues in database queries and provides recommended changes for query optimization.
The image below shows a graphical query analysis in Idera DB Optimizer.
Other Idera DB Optimizer features are:
- Monitoring for performance bottlenecks.
- A wait-time analysis visual representation.
- alternative SQL query execution paths.
- A one-click function to modify a query according to recommended changes.
DB Optimizer comes with a free 14-day trial allowing users to test its features.
DbForge Studio for MySQL
DbForge Studio is a query optimization tool that features various server management tools for monitoring performance and tuning SQL queries.
Some of its features are:
- Query builder and profiler, a query optimization tool to tune MySQL queries and investigate query performance issues.
- Auto-complete system when entering queries.
- Code explorer for inspecting or writing query code.
- Report designer for sending performance issues feedback to your team.
- Index manager for resolving index fragmentation.
The image below shows DbForge Studio Query Profiler UI for optimizing queries.
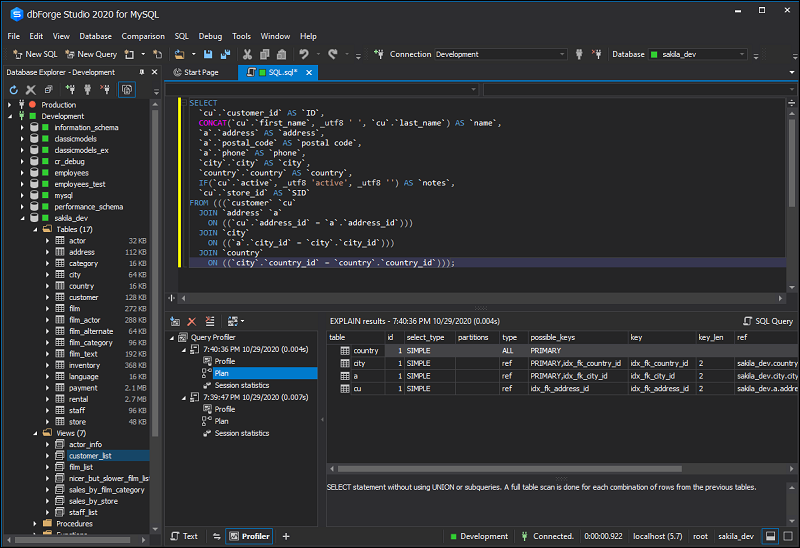
DbForge Studio helps monitor query performance and optimize queries by offering SQL formatting, SQL snippets, and code navigation for easier query management.
The tool comes with a free trial and three paid versions - Standard, Professional, and Enterprise.
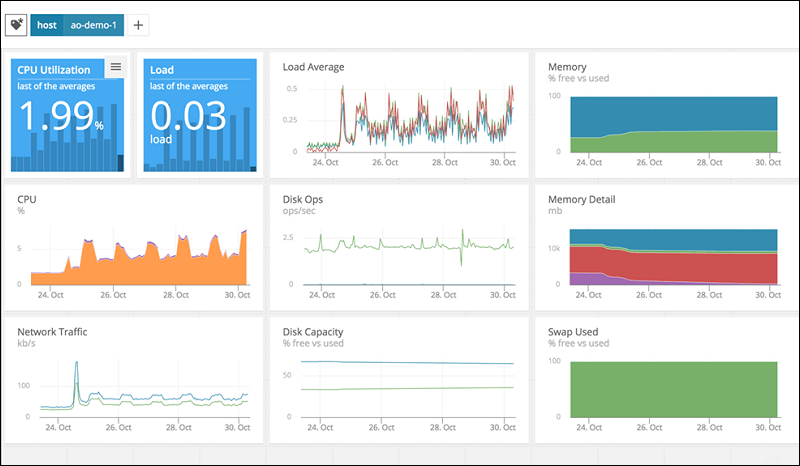
AppOptics APM
AppOptics APM is a cloud-based performance monitoring tool that features database optimization utilities. It identifies the root cause of query performance issues and helps users resolve them.
AppOptics APM focuses supports MySQL, Microsoft SQL Server, Oracle, Postgres, and Apache database management systems.
Here is an example of AppOptics infrastructure monitoring dashboard:
Some of its features are:
- Inspecting why specific queries underperform and take a long time to retrieve results.
- Filtering inefficient joins and columns that need indexing.
- Analysis engine for ensuring an efficient query-database interaction.
- Analyzing databases regardless of the hosting type - on-site, remote, or cloud.
The software comes with a 14-day free trial or a paid annual subscription.
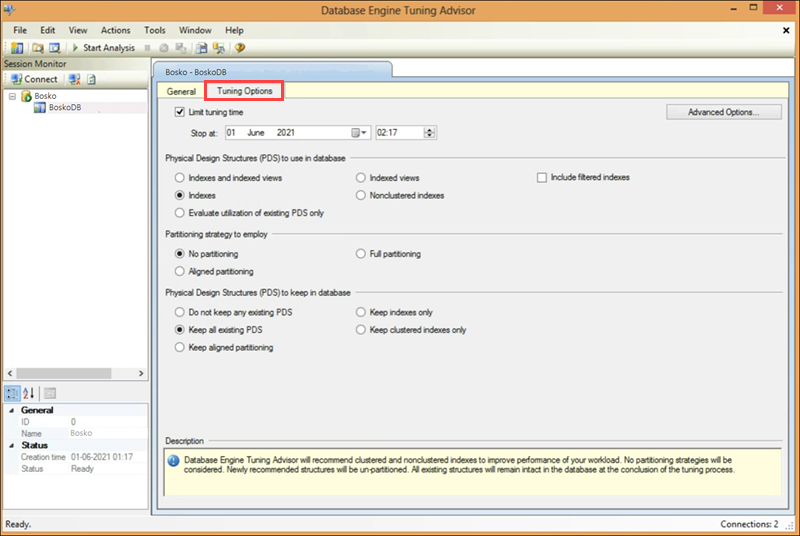
Microsoft SQL Server Management Studio (SSMS)
Microsoft SMSS is a free relational database tool for the Microsoft SQL Server. The Studio comes with the SQL Server Database Engine Tuning Advisor (DTA), a utility for query optimization.
The DTA monitors query performance and optimizes queries by adding indexes and partition queries to resolve performance issues and shorten run time.
The image below shows the Database Engine Tuning Advisor in SQL Server Studio.
The Studio is available for Windows 10, 8, 8.1, 7, 2012, and 2008 R2. SMSS is ideal for small businesses because it is free to use. The tool offers good data reporting, although it isn’t as advanced as some of the other SQL server management tools on this list.
Conclusion
Query optimization tools simplify performance monitoring and SQL optimization, especially if they are part of your day-to-day workload.
Feel free to test out the tools from this list, as most of them have free trials, and decide which one suits your needs best while not hurting your budget.
